Showing posts with label technical anlaysis. Show all posts
Showing posts with label technical anlaysis. Show all posts
Thursday, December 30, 2010
Nifty 6080 key level for short term trend
6080-6100 is a key zone for short term traders in Nifty. A move above this should see significant short covering and also fresh longs being initiated. Watch this zone to see if the current uptrend in the Nifty is to sustain.


Thursday, December 16, 2010
Nifty sideways and rangebound
Overall the Nifty could be rangebound between 5700 to 6200…this is a sideways kind of market. It'svery difficult to say which way the market will move till we come out of this range. 5727 was the low we reached on 26 november so if that is taken out further bearish for the short term.
FIIs are selling which of course needs to be watched very closely.
5400-5500 should prove to be a strong support which is also the region of the 200 day MA
FIIs are selling which of course needs to be watched very closely.
5400-5500 should prove to be a strong support which is also the region of the 200 day MA
Friday, September 17, 2010
Nifty 5900 and beyond
Charts are extremely bullish, it’s a quiet bull market with low volatility. VIX is currently around 18 levels. We continue to remain bullish on the Nifty. Nifty is now rewarding investors for their patience after a long rangebound period. There is no resistance till 6350. FIIs continue to pump in money. Retail has started entering and will do so increasingly as the rally progresses.
Looking forward to Nifty 6350 and higher.
Looking forward to Nifty 6350 and higher.
Wednesday, September 15, 2010
Watch the FII inflow
FIIs have pumped in 7700 cr in June, 8300 cr in July, 7200 cr in August and 7000 cr in Sept till date. We have analysed FII inflows/outflows since the time data is available and the market movements clearly rise and fall along with the FII inflows and outflows. More on this later - but for the time being FIIs are pumping in money in a big way and as long as that trend continues the Nifty is headed in one direction - upwards!
Tuesday, September 14, 2010
Stay long or be wrong!
Its a bull market...current momentum, breadth is very strong. Retail hasn't participated yet so they will throw in the towel and join now. Very high probability of huge moves in the Nifty now. Enjoy the ride!
Friday, September 3, 2010
Market update
Overall trend is UP. Markets are looking very strong. Charts are bullish.
FIIs continue to pump in money, High probability that we see an explosive move upwards.
Auto, banking, consumer durables, OMC look extremely bullish.
Telecom (Bharti Airtel and Idea) and metals (Hindalco & Jindal Steel & Power) have given fresh buy signals and can be the next potential outperforming sectors.
FIIs continue to pump in money, High probability that we see an explosive move upwards.
Auto, banking, consumer durables, OMC look extremely bullish.
Telecom (Bharti Airtel and Idea) and metals (Hindalco & Jindal Steel & Power) have given fresh buy signals and can be the next potential outperforming sectors.
Thursday, July 8, 2010
SP500 breaks 1040 - downtrend still alive
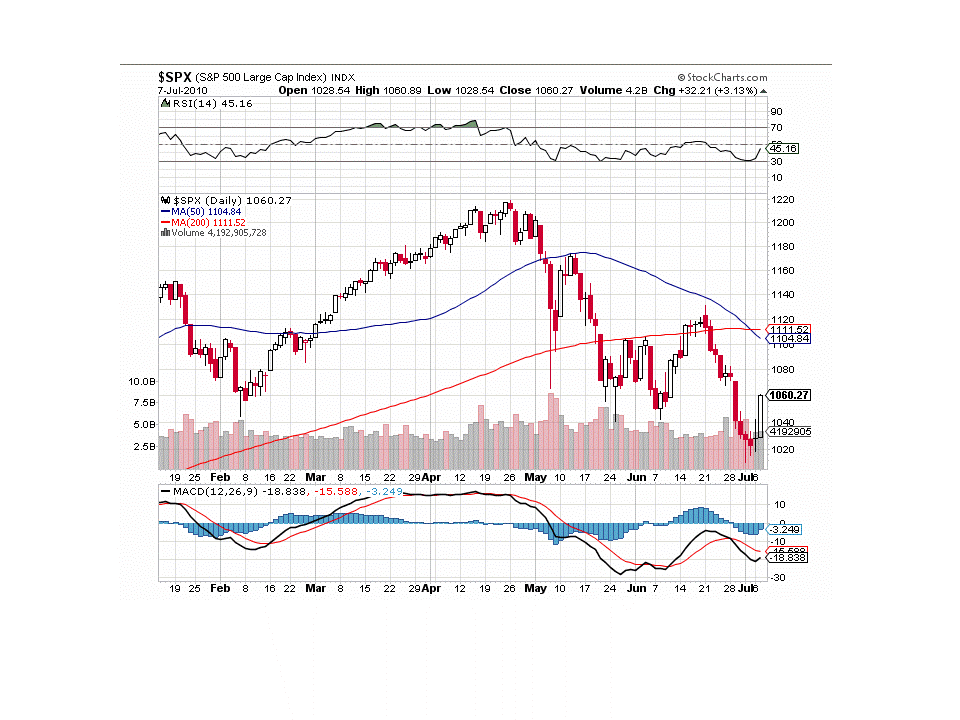
The SP500 broke the 1040 resistance yesterday. Whether this is a deadcat bounce or the bears waiting to catch breath, time will tell. However for the current bearish trend of lower tops and lower bottoms to change we need to break above 1130. Till then the trend is clearly bearish - with both a death cross (50 day moving average crossing below 200 day moving average) and a pattern of lower tops and lower bottoms in place.
Monday, July 5, 2010
Gold as an investment

Everybody is long in Gold these days. We keep hearing stories about how people should have listened to XYZ's advise and kept accumulating gold. The above chart shows if we had invested money in Gold in 1980 we would be worse off after adjusting for inflation. Buy-and-hold anybody?
The Real Mega-Bears

This chart from D-short shows the inflation-adjusted overlay of three secular bear markets. It aligns the current S&P 500 from the top of the Tech Bubble in March 2000, the Dow in of 1929, and the Nikkei 225 from its 1989 bubble high.
This chart shows real (inflation-adjusted) analysis of long-term market behavior. The nominal all-time high in the index occurred in October 2007, but when we adjust for inflation, the "real" all-time high for the S&P 500 occurred in March 2000.
The entire post can be read here:
http://dshort.com/charts/mega-bear-2000-comparisons.html?mega-bear-2000-extended
Friday, July 2, 2010
Market Update
China had a high of 6144 in October 2007 and had crashed to 5100 before India crashed on 21 Jan. Levels reached in Oct 2009 were 1650
Currently at 2350 levels.
India crashed from 6300 to 2250 and is currently at 5250.
S&P has broken a crucial level of 1040. 1040 has served as support 4 times in the past. Broken low of 2 February so started pattern of lower tops and lower bottoms.
It is quite possible China is again a leader for a global selloff. Because if there is a global selloff India will not be decoupled as there will be a flight to safety from all asset classes.
So if there is a crash in India it is possible it will be a steep one like Jan 2008.
4875 is a number that needs to be maintained for the bull move to be intact.
Currently at 2350 levels.
India crashed from 6300 to 2250 and is currently at 5250.
S&P has broken a crucial level of 1040. 1040 has served as support 4 times in the past. Broken low of 2 February so started pattern of lower tops and lower bottoms.
It is quite possible China is again a leader for a global selloff. Because if there is a global selloff India will not be decoupled as there will be a flight to safety from all asset classes.
So if there is a crash in India it is possible it will be a steep one like Jan 2008.
4875 is a number that needs to be maintained for the bull move to be intact.
Wednesday, June 16, 2010
Nifty breaks out of range
• We have come out of the range 4900-5200
• FIIs have been buyers for the past 7-10 days
• Nifty VIX has declined from 35 to 23…so there is less fear in the market
If traders are looking at playing the short term momentum the trend is clearly UP and they can look at going long with 5150 as SL
5398 which we reached on 7 April has to be taken out to confirm intermediate trend of higher tops and higher bottoms
5150-5200 which acted as a strong resistance should now act as a support
• FIIs have been buyers for the past 7-10 days
• Nifty VIX has declined from 35 to 23…so there is less fear in the market
If traders are looking at playing the short term momentum the trend is clearly UP and they can look at going long with 5150 as SL
5398 which we reached on 7 April has to be taken out to confirm intermediate trend of higher tops and higher bottoms
5150-5200 which acted as a strong resistance should now act as a support
Sunday, June 6, 2010
Housing risk in China greater than US, UK
An interview with the Financial Times by Li Daokui, who serves on the Chinese central bank’s monetary policy committee, included an uncharacteristically candid comments on the state of China’s housing market and by implication, the direction of Chinese interest rate movements. From the Financial Times:
“The housing market problem in China is actually much, much more fundamental, much bigger than the housing market problem in the US and UK before your financial crisis,” he said in an interview. “It is more than [just] a bubble problem.”…
The entire post can be read here:
http://www.nakedcapitalism.com/2010/06/chinese-monetary-official-housing-risk-greater-than-in-us-uk-pre-crisis.html
“The housing market problem in China is actually much, much more fundamental, much bigger than the housing market problem in the US and UK before your financial crisis,” he said in an interview. “It is more than [just] a bubble problem.”…
The entire post can be read here:
http://www.nakedcapitalism.com/2010/06/chinese-monetary-official-housing-risk-greater-than-in-us-uk-pre-crisis.html
Monday, March 8, 2010
Nifty update
Nifty short term trend remains UP...traders can wait for pullbacks to enter...I would wait for a close below 4950 to go short again....
Till then stay long or be wrong!
M52FDAZTX8V5
Till then stay long or be wrong!
M52FDAZTX8V5
Sunday, January 31, 2010
Sovereign Defaults and CDS
Keep a close eye on the CDS rates of Greece, Dubai and Portugal
Credit default swaps (CDS) are insurance policies that pay investors in case there is a default.
Sovereign default like the fear that arose in Dubai could be the next trigger in the bear market that is likely in 2010.
Credit default swaps (CDS) are insurance policies that pay investors in case there is a default.
Sovereign default like the fear that arose in Dubai could be the next trigger in the bear market that is likely in 2010.
Sunday, November 30, 2008
Volatile Bear
Research has shown that there are 6 market types:
1) Volatile Bull
2) Quiet Bull
3) Volatile sideways
4) Quiet sideways
5) Volatile Bear
6) Quiet Bear
There is no trading strategy which works well in all 6 market types. A smart trader should have different strategies for different market types.
Ever since the Lehman Brothers crash, Nifty has been going through a volatile bear phase. Traders will find their stops getting hit frequently. How should we trade this market? It is best to remain out of this market from a momentum trading point of view. Having no position is also a position. One could look at various products in the derivatives area to profit from this market type.
1) Volatile Bull
2) Quiet Bull
3) Volatile sideways
4) Quiet sideways
5) Volatile Bear
6) Quiet Bear
There is no trading strategy which works well in all 6 market types. A smart trader should have different strategies for different market types.
Ever since the Lehman Brothers crash, Nifty has been going through a volatile bear phase. Traders will find their stops getting hit frequently. How should we trade this market? It is best to remain out of this market from a momentum trading point of view. Having no position is also a position. One could look at various products in the derivatives area to profit from this market type.
Subscribe to:
Posts (Atom)


